Ludvig Lindblom
I'm a senior front-end developer and creative technologist specializing in UI development, spending most of my time working closely with art directors and UX designers transforming ideas into intuitive, responsive and beautiful interfaces.
I published my first site back in early 1994 - making it one of the first 5000 websites!
Currently, I am a Technology Advisor at Forefront Ignite, an innovation hub and part of the Forefront Group in Stockholm, Sweden.
Threads ✦ Bluesky ✦ LinkedIn ✦ GitHub ✦ CodePen ✦ CSS Battle

Stadsvolymer (city volumes/urban processes)
It started in April 2014 when my friend Pontus Willebrand was visiting and asked if I knew about the Arduino platform, and if I could help him program for one. Pontus was planning to implement an Arduino in his degree project at Forsbergs School of Design and Advertising.
A little about Arduino
It is an open-source physical computing platform, based on a simple microcontroller board, and a development environment for writing software for the board.
It can be used to develop interactive objects, taking inputs from various switches or sensors and controlling a variety of lights, motors, and other physical outputs.
The projects can be standalone or they can communicate with software running on the computer and the programming language is an implementation of Wiring, a programming framework for microcontrollers.
There are a variety of accessories to expand the circuit board, like building blocks that you connect to gain extra functions. Among these so-called “shields” is one that allows you to connect more and more powerful motors, one to communicate over ethernet and/or wifi, and more.
The Stadsvolymer project
Pontus' idea for his degree project revolved around the city's processes. The reasons for this was that the theme of this year's degree exhibition was precisely "processes".
Excerpt from Forsberg's graduation exhibition 2014
“A process strives for a result. It takes detours, shortcuts, starts over again but has its eyes on the end. So have we. After two years as creators at Forsbergs, we have honed our craft. We have become creators with a creative height that has begun to stretch along the roof of the school. It has been two years of a constant and developing process that we often talk about. The personal process, both individually and in a group. Now we have reached the roof of the school and must continue the process in some other place. We have grown out of the clothes of the school and must go out and take on something bigger that we can continue to grow in and adapt our craft to. We think that the tools are as important as the portfolio. The craft is as important as the idea. The process is as important as the result.”
Exactly which of the city's processes would be incorporated into the project was not yet clear, but he had many ideas and a good vision.
The idea was to build a structure out of wood and foamboard, and use what is called “projection mapping” to use the structure as a projection surface for different types of data. The structure would also be interactive in a way that visitors would be able to interact with it via various sensors, and perhaps even over the internet, to control parts of it. And that’s where I came in.
Building the structure, creating all the video material, working with projection mapping, and acquiring data from various official sources such as the Swedish Statistics Agency were no problem. But programming the Arduino so that it could control different parts is where Pontus required some help.
The development
We started by spending an evening at Pontus's place where I familiarized myself with the hardware, the development environment, and the programming language before deciding that I could help.
Then it slowly but surely rolled on. Pontus asked questions about what would be possible, I answered to the best of my ability, he was at school building various constructions and tinkering with LEGO Technic that would function as conveyor belts, pistons and other things that could make the construction move, and I was at home learning more about the Arduino.
After a while, a more concrete idea for the project had been developed and since the beginning of May we spent a couple of weekends at Forsbergs where we built LEGO, connected different types of sensors and motors to the Arduino, and wrote code.
It was decided that the structure would have three PIR (passive infrared) sensors that would control different types of video sequences via projection mapping, and that one of them would control a piston that would create movement in the structure.
There would also be a conveyor belt hidden inside the structure that at a fixed interval would spit out a small plastic figure onto a platform to represent childbirth in Stockholm.
There would also be another moving part of the structure, but this would be controlled via a web page that visitors could access. The idea was that visitors who went to the page would be able to enter their Twitter name and/or real name, as well as an optional message.
The message would then be implemented in the video projection so it was just a matter of saving the data in a database, building a small API that responded to calls with an XML output that was retrieved from a software that was pinging the API and sending it to the projection software.
If you filled in your Twitter name, the @stadsvolymer account on Twitter also wrote a tweet and thanked you via mention for visiting the exhibition. If you only filled in your name, it still wrote a tweet, but without a mention. This was done through a Twitter app that I wrote.
If you filled in your Twitter name, you also got a button on the website, and if you clicked on it, various values were saved in a database for which I wrote another API that returned when someone had clicked on the button. The Arduino in turn was checking against that API and when it received information that someone had clicked on the button, a couple of doors in the construction opened and a message was projected where they were asked to take a business card that was behind the doors.
The actual code for all this wasn't particularly advanced, the hard part was tying everything together with the external APIs I set up, and getting the ethernet shield we had on the Arduino to work the way we wanted. We ended up getting our own 4G router and connecting the Arduino to it, so we were sure to have a stable, dedicated connection.
Since the usual way to program delays in Arduino code involves locking all functions for as long as you want, we couldn't use this method. We had to have different functions that were ticking all the time, independently of each other. To solve this, we had to use a third-party library for Arduino called elapsedMillis, and we also had to use some other code libraries to be able to do what we wanted, e.g. to control the speed of the servo motors we were using.
In addition to all this, I also set up a small API to return specific real-time data from SL (Stockholms public transportation), namely when the next and upcoming departure/s from Zinkensdamm subway station are. Pontus would then retrieve this data just like other data and project it onto the construction when one of the three themes that were determined was triggered by one of the PIR sensors.
The three themes
Pontus chose to work with three themes for the different projections, these were:
- Population increases and construction
- Quality of life and socio-economic
- Communication
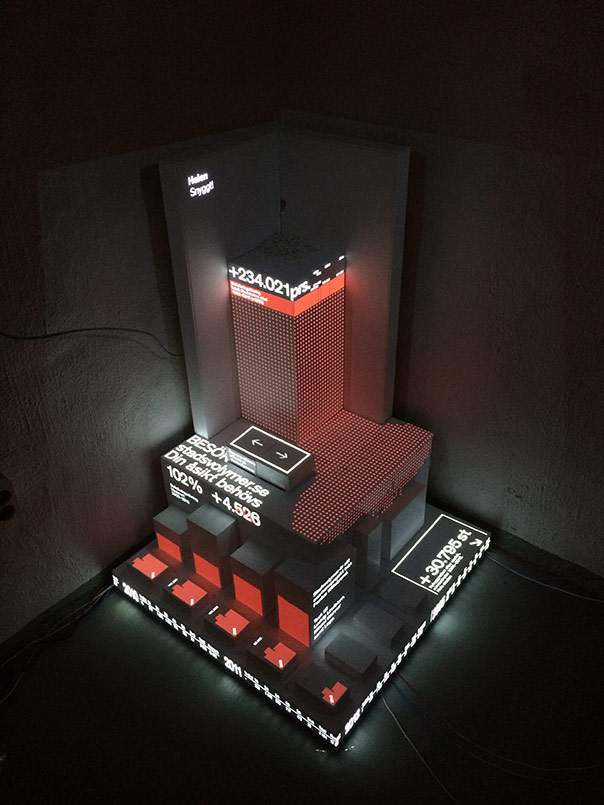
For population increases and construction, data on for example new construction and childbearing, was projected.
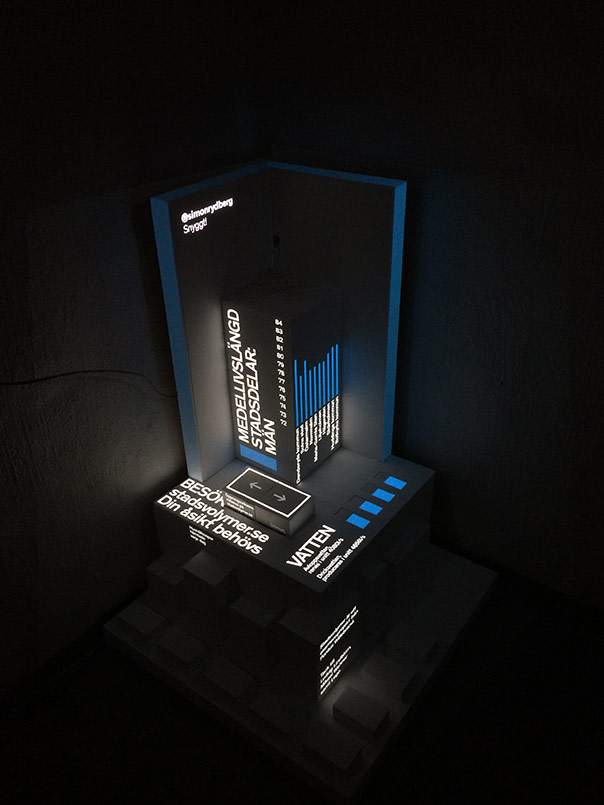
For the quality of life and socioeconomic theme, data on average life expectancy for men and women in different municipalities in Stockholm, information on water distribution and the wastewater treatment procedure were displayed.
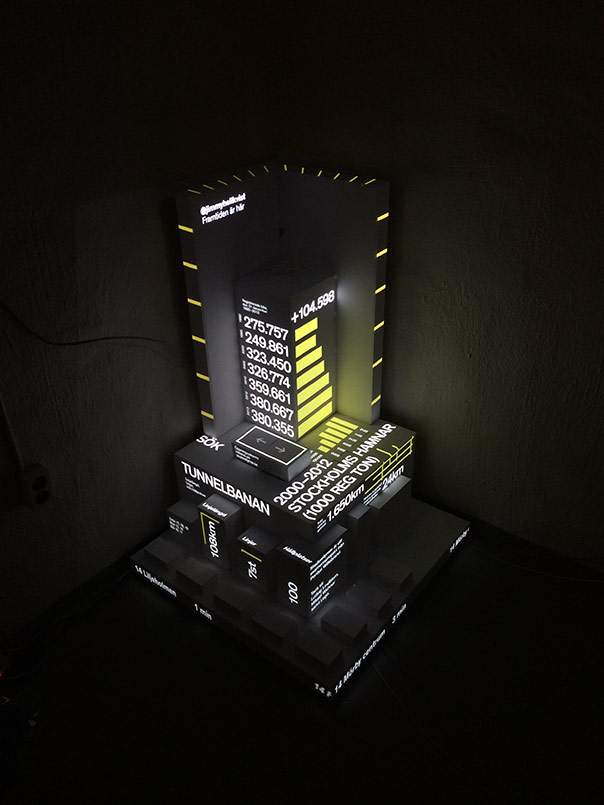
And for the theme of communication, data was projected from Stockholm's subway system, the city's port traffic, the number of registered vehicles during different time intervals, and more.
These three themes each had a color; yellow, red, and blue, and the data that was projected was not just static but was animated to visualize the city processes. For example, the real-time data from SL scrolled like a real sign in the subway, “water” ran down the side of the building when they were talking about the purification process, and red dots filled other areas to visualize the population increase.
The result
I personally think the end result was fantastic. Far better than I could have imagined, and judging by all the statements and comments from visitors to the exhibition, it was a success.
Theme blue, Quality of life and socio-economic
Theme red, population increases and construction
Theme yellow, communication
Of course, I'll offer a video so you can see how everything came together.
Bonus
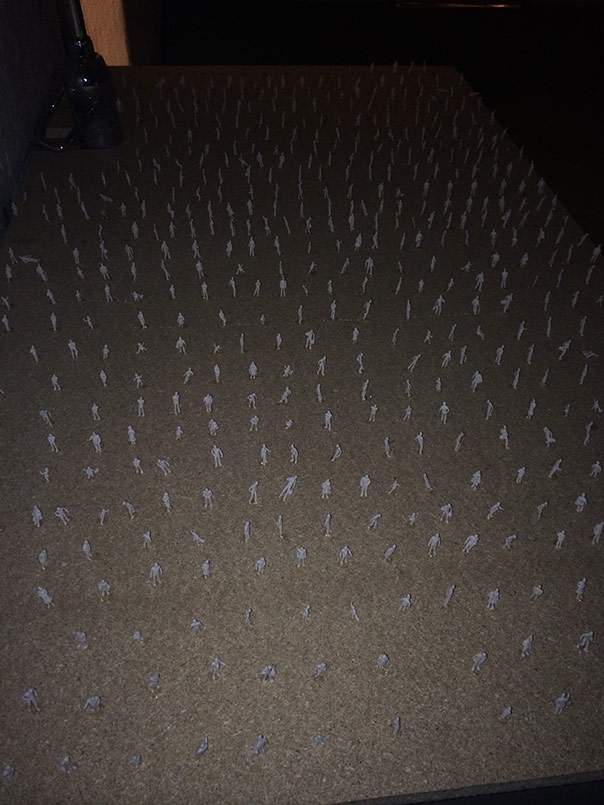
In the room that Pontus had at his disposal, there was an old sink that unfortunately couldn't be moved. So to make the best of the situation, he covered it with a wooden board and glued 450 model figures (the same ones used on the assembly line to represent childbirth in Stockholm) onto the board.
These 450 figures together represented the 450,000 people who were currently in the housing queue in Stockholm.
The construction
The structure itself was built from boards from a hardware store that were screwed together with angle iron, and covered with white foamboard.
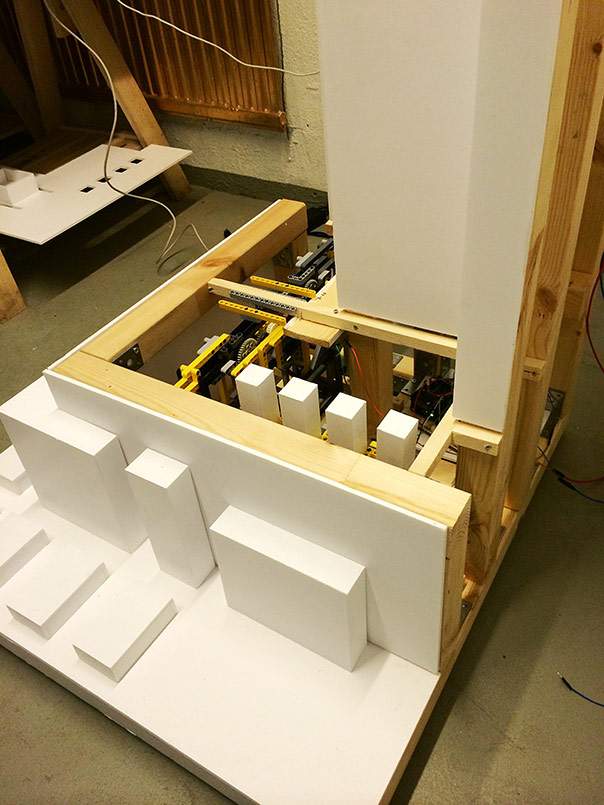
Inside the construction, various moving parts built from LEGO Technic were assembled, most of which had been purchased on online auction sites, or from the Model Team store in Bandhagen.
It was also inside the construction that the Arduino, the hardware itself, was placed.
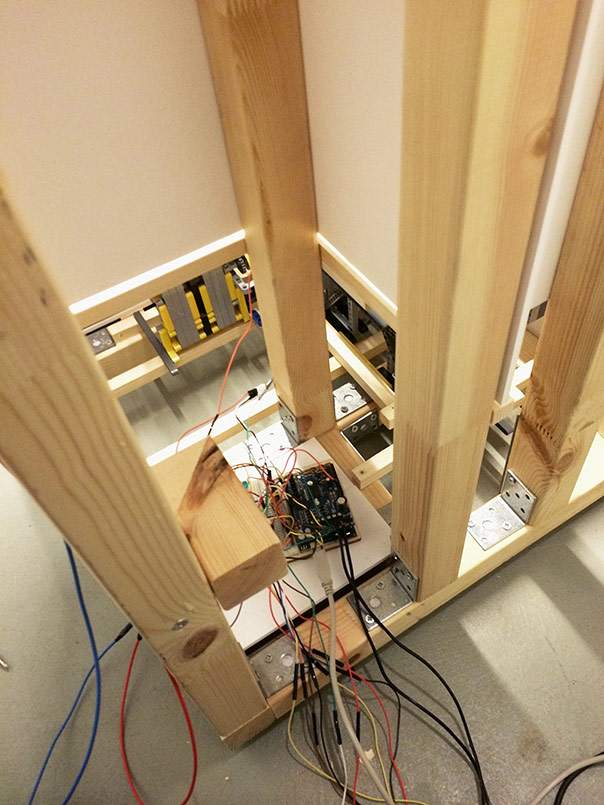
The hardware
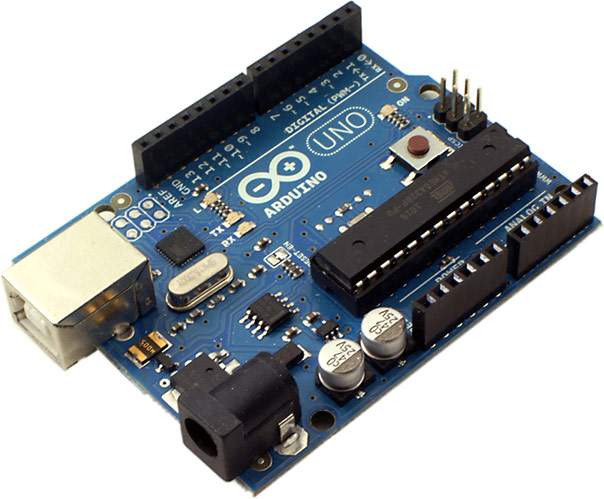
The hardware consisted of an Arduino Uno Rev3 which was purchased as part of a Starter Kit from Kjell & Co. From them we also bought some extra sensors and motors, as well as an ethernet shield, and a motor shield.
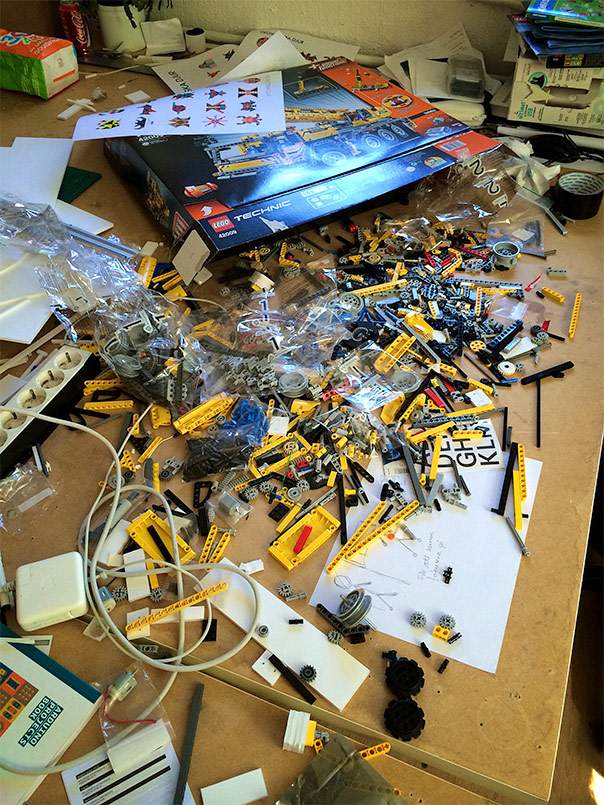
We also had thousands of LEGO Technic pieces at our disposal.
We also used a 4G-router from TP-Link, a TL-MR3420, and a 4G subscription from Telia to have a dedicated network for the project.
Software
To retrieve data from the APIs I wrote, we used Quartz Composer, which is a collection of technologies from Apple that enabled us to retrieve data via RSS, manage it, and render it as videos.
Projection Mapping was carried out with Resolume.
Code and programming
The website stadsvolymer.se (no longer active) was written in PHP against a MySQL database, and the Twitter app that posted tweets to visitors who entered their Twitter name used TwitterOAuth, a code library for handling OAuth for Twitter's REST API. For simplicity, I used parts of Bootstrap to style the page, and jQuery to handle form postings and requests to the server via AJAX.
The code for retrieving subway information used the SL Real-time Information API from Trafiklab and I wrote my own small wrapper to speed up the calls and extract parts of the data.
Other data that was projected onto the construction was retrieved in advance from various authorities such as Swedish Statistics Agency or the Stockholm City Data Portal.
The code that controlled the Arduino and received signals from the various sensors and the ethernet shield, as well as sent commands to the motors and servo motors, was written in Wiring, the programming framework for microcontrollers that Arduino, among others, uses.
As I mentioned earlier in the text, we could not use the usual delay() function in Wiring, but we had to import the elapsedMillis library to be able to write functions that could pause themselves without stopping the rest of the functions from running.
We also used the third-party library VarSpeedServo written by Ewan Branda to be able to control the speed of the servo motors which otherwise have a fixed speed.
And since the ethernet shield we bought was not the official one based on a Wiznet W5100 chip, but another one based on the ENC28J60 chip, we had to use another third-party library to be able to write the code as if it were an original shield. That library is called UIPEthernet and is written by Norbert Truchsess.
My code, without the linked libraries, ended up being just under 400 lines (with comments) and wasn't really anything advanced. Or I'm simply writing functional and optimized code (not likely).
And that was it about the development process itself.